Find direction through thematic analysis or use custom-built tools to deep-dive into your data. Perfect for community surveys or stakeholder workshop brainstorming sessions.
Why Thematic Analysis?
Open-ended consultation and survey questions will provide you with a vast array of answers – some people will answer succinctly, possibly with only a single word. Others will provide you with a highly subjective essay in response to the same question. On first glance, it is hard to see the future direction that you need to follow.
Thematic analysis identifies the predominant patterns within all responses to your question by identifying the recurring themes.
The result is a clear picture of the common areas of concern, within which the frequent requests and recommendations can be identified.
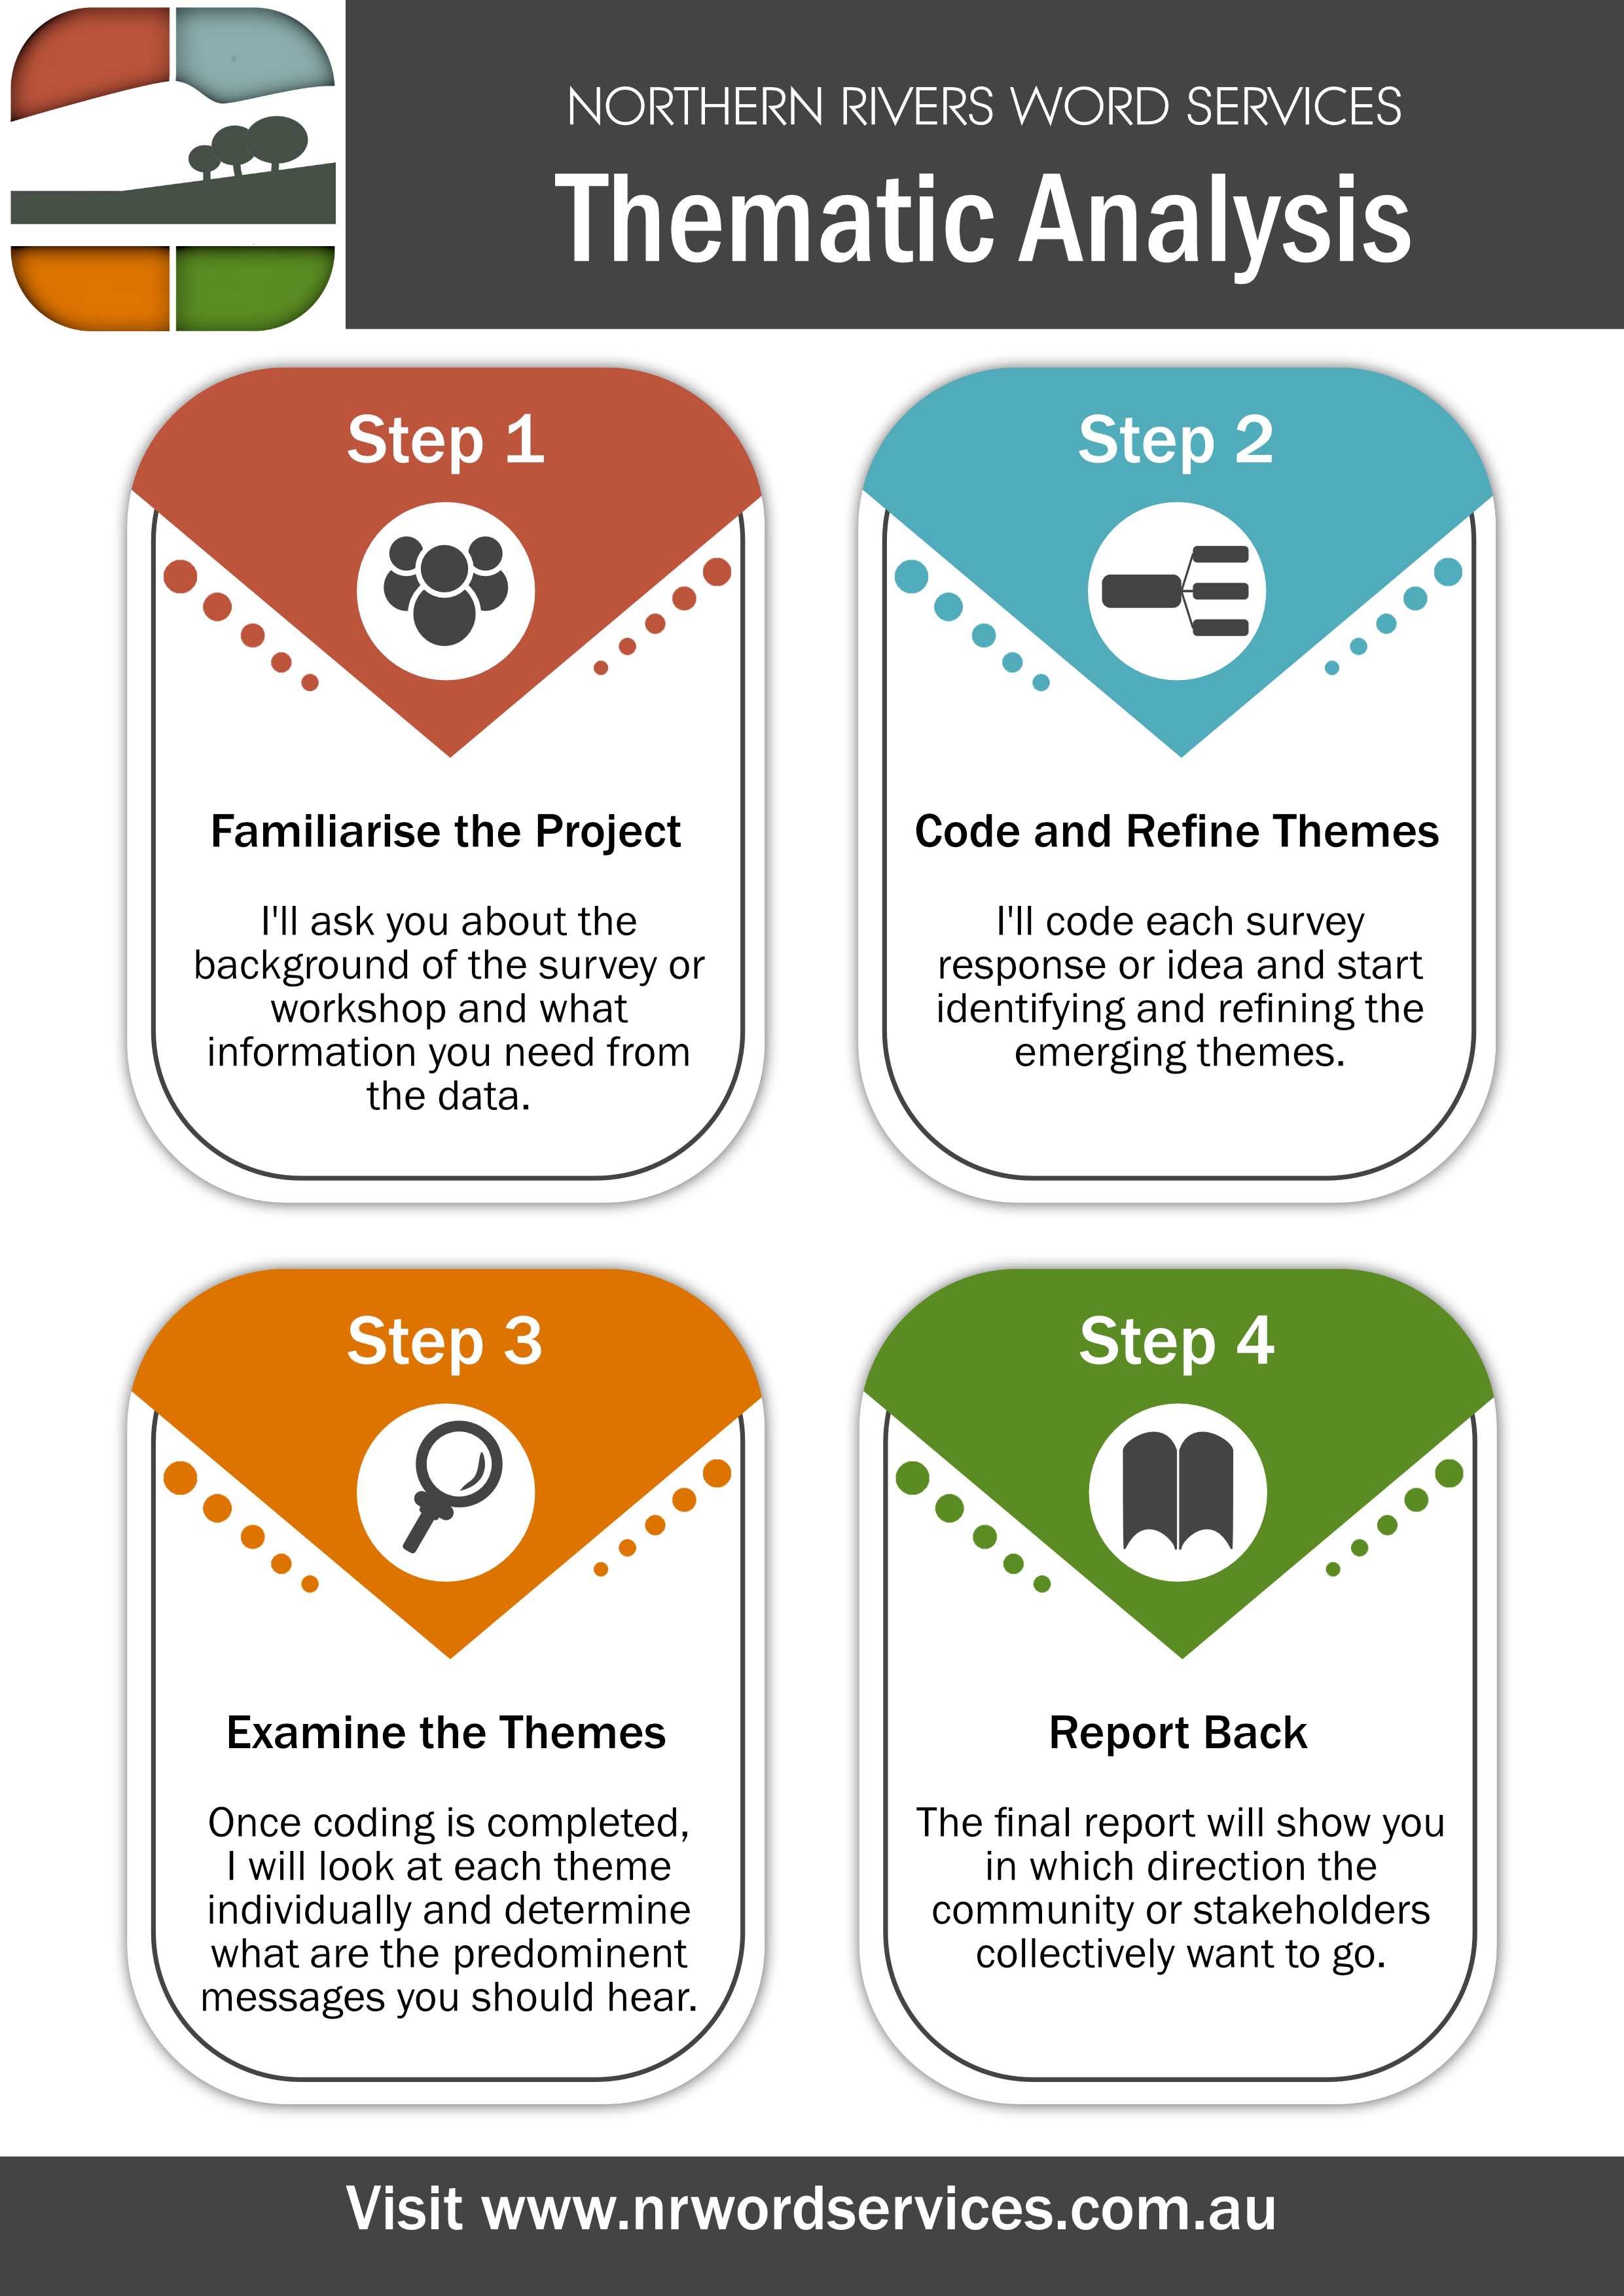
NRWS Thematic Analysis
Thematic analysis and coding
NRWS uses reflexive, data-driven methods, to ensure that the identified themes match the messages imparted by the community and limit the influence of prior expectations.
Clear and concise reporting
Reporting can include a clear definition of each identified theme and in-depth discussion of the major concepts, concerns and recommendations within each.
The results can be reported upon separately or as part of a complete Consultation Outcomes Report, which can include any of the following:
- Executive Summary
- Project background
- Overview of consultations
- Key themes and outcomes
- Priority concerns
- Full thematic definitions and discussion
- Desktop research
- Recommendations
- Next steps
- Glossary
The final report can be written within your own company reporting template and style, ready to send to your client.
Visual aids and summaries
The identified themes can be quantified to produce summary level graphs for easy reference, and a glossary of each theme included with the report.
Excel Survey Tools
Searchable and filterable Excel tools
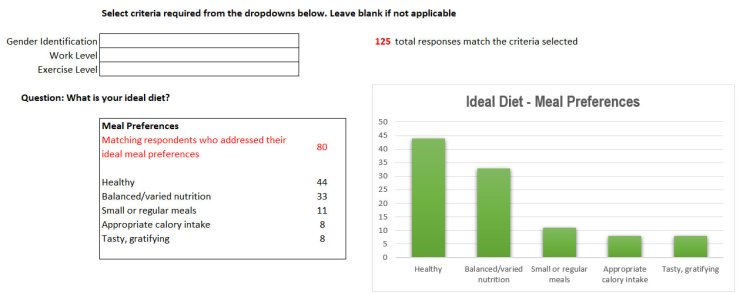
Quantitative analysis of close-ended survey results is simple with custom-built Excel tools. As Excel is a program with the lion’s share of the market, access to important graphing and analysis of your survey is no longer an issue.
Want to find the differences between different demographic groups in your dataset? With the click of a button, you can zoom in to see what was the most important issues within each group, and tailor your response to ensure that a diverse range of needs are met.
But, this is not limited to close-ended questions. Combined with thematic analysis, the NRWS custom Excel survey tool will let you see at a glance which themes were the most commonly raised in open-ended questions, and so which were the issues that were at the forefront of everyone’s thoughts.